
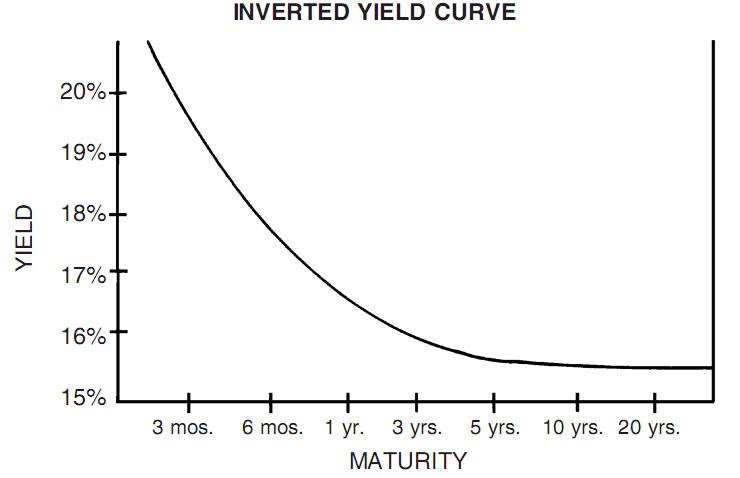
One of the nicest stylised facts in applied economics is that if the Fed inverts the yield curve it will cause a recession. Inverting the yield curve basically means that the Fed hikes the short-term interest rate goes higher than the long-term interest rate. In theory this should lead to long-term lending drying up, investment falling significantly (usually in housing and inventories) and, ultimately, a recession.
The track record of this as an indicator of recessions in the US is too impressive to dismiss. Take a look at the chart below. The shaded areas are recessions. As you can see, every time the short-term interest rate (blue line) climbs about the long-term interest rate (red line) we see a recession within around 12 months or so.
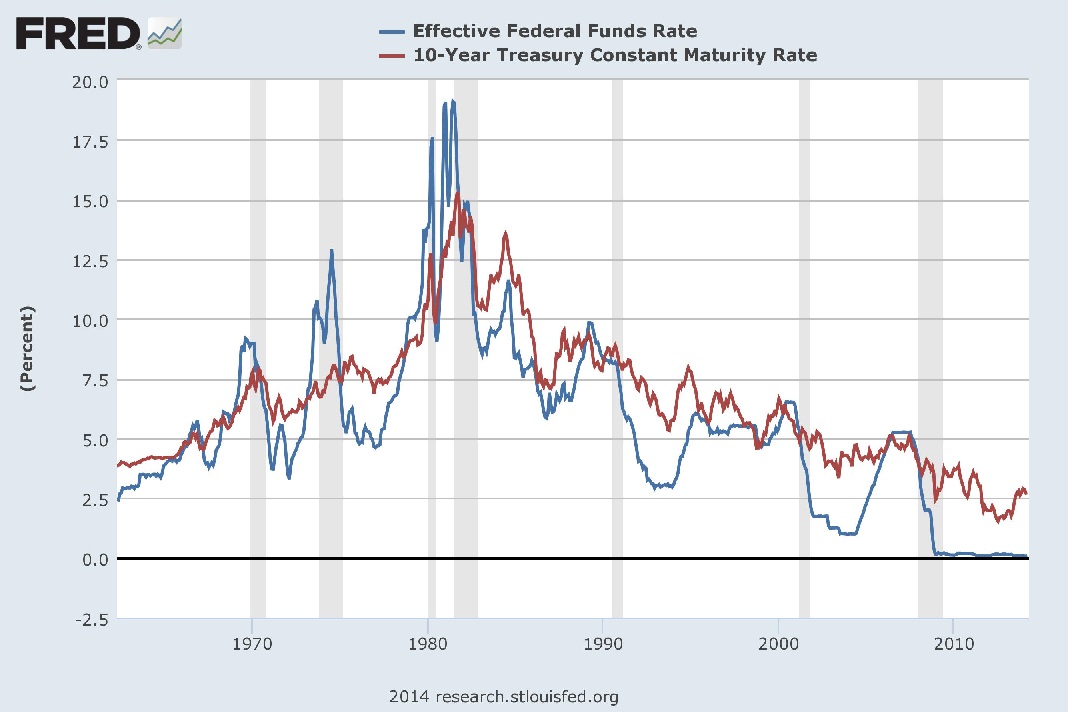
The question, however, is whether this is universal economic constant. And when we turn to the data from other countries we quickly see that it is not.
All the data that follows if from the St. Louis Fed but I have done the graphs myself so that I could include lines indicating British and Japanese recessions.
Okay, so let’s take the UK first. This graph is pretty rough but the green lines are the starts of recessions and the thinner black lines are points when the short-term interest rate rose above the long-term interest rate without causing a recession. The short-term interest rate is the blue line and the long-term interest rate is the red line.

As we can see, the story here is a bit more complicated than in the US. Only three out of the five recessions were precipitated by an inverted yield curve. Meanwhile the yield curve inverted seven times without causing a recession.
This does not bode well for the notion that this correlation might be constant across time and space.
So, let’s turn to Japan. Unfortunately, the data available for Japan is only from during the so-called Lost (Two) Decade(s) and so we will be dealing with a rather unusual period. Nevertheless, it should still prove interesting.
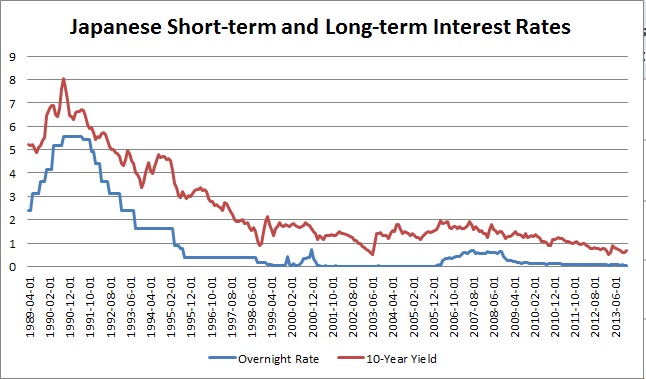
As the reader can see I have not bothered to mark the recessions in this chart. Why? Because it is quite clear that the yield curve never inverted in this period. The short-term interest rate (blue) always stayed below the long-term interest rate (red). What’s more, in this period Japan had five recessions. Including a massive one at the beginning of the 1990s. Clearly these were not correlated with and therefore not caused by an inverted yield curve.
So, the question remains: why is this correlation so strong in the US? This is impossible to answer without some doubt but allow me to shoot from the hip a little and throw out some potential causes. (Suggestions welcome in the comments!)
1. The US is a very insulated economy: due to this recessions are caused largely by internal factors.
2. The US economy is more credit-driven than other economies: hence, the interest rate plays a larger role in investment and consumption decisions.
3. The US has tended to use monetary policy more consistently than its neighbors: which is why the economy has become more ‘used’ to falling into recession when monetary policy is aggressively tightened.
4. There is a self-fulfilling belief in the US that an inverted yield curve leads to recessions.
Frankly, I think that the answer lies somewhere in between the four reasons listed above. I think that reason number four is also probably the most important. Folks in the US get very hot and bothered about inverted yield curves — reflecting the American love for projecting engineering-like causality into just about every field — and this likely has a sort of ‘self-fulfilling prophecy’ effect.
Anyway, whatever the reason the facts are clear: the rule-of-thumb that a recession will generally follow on the back of an inverted yield curve is a good one for the US — whether it is based on hocus pocus or otherwise — but it is probably useless to apply outside of the US. Once again we learn that time-tested lesson: there are no universal laws in that all-too historical field known as economics.
Update: Mark Sadowski has linked to an interesting BIS paper in the comment section entitled Does the Term Structure Predict Recessions? The International Evidence. It provides a very nice table of the probability of having a recession four quarters ahead of interest rate hikes.

The authors explain how to interpret this table as such,
To interpret the results in Table 2, consider first the case of Germany, the country for which the predictive power of the spread appears the strongest. Suppose first that long interest rates are 4% above short interest rates, so that the spread is 4%. The table indicates that the probability that a recession will occur in four quarters’ time is 0%. However, as short rates rise relative to long rates, the probability of a recession increases as well. Thus, when the spread is 2%, the probability is 7%, and when the spread is 0% the probability is 41%. Note, furthermore, that as the spread turns increasingly negative the probabilities rise quickly. When short rates are 1% above long rates, the probability of a recession rises to 66%. When the spread is -2%, the probability is 85%. Finally, at a spread of -4% the probability that the economy will be in a recession in four quarters is 99%. (p10)
I think that the results of this study pretty much confirm what I said in the above piece: the relationship between an inverted yield curve and recessions in the UK and Japan is not as solid as in the US and should be treated with caution (in Japan’s case, with extreme caution).
Beyond that, one or two more comments. Germany seems to be another country, ala the US, where the relationship holds. I am somewhat suspect of the Belgian and Dutch data because all the data was taken from the years 1972-1993. In 14 of these 21 years the Belgian franc and the Dutch guilder were pegged to the Deutschmark under the ERM arrangement. So too was the French franc, but given that France is a bigger country we do not see quite as much of a pass-through effect. Finally, the Canadian data confirms my view that we should treat inverted yield curves with a bit more care than they are usually treated.

A closer inspection of the “reserve currency” status of US T-Bills in the mix may also be fruitful. The 10-yr coupon rate falling relative to shorter maturities might be the vehicle that carries the sell-off (i.e.it drives a signal to debtors of the self-fulfilling prophecy.
Don’t see why it wouldn’t happen in other countries.
I think the self-fulfilling thing is that banks get spooked and the media starts saying “yield curve! recession!” and so on.
There is a premium that shows up in bond yields as short rates fall. Even if you expect the short rate to be zero over the next 5 years, you still want to have a positive yield on the 5-year. This is because the risk is one way – short rates can only go up. This is not true when rates are well above zero. As a result, the Japanese experience is easily understood. I have talked about this a few times on my blog. Note that this observation is not widely known amongst economists, but it was implicitly understood by Japanese fixed income strategists. (You normally expect a term premium, but it should be magnified in a low rate environment.)
As for the UK, the yield curve was referred to as the “freak show of the global capital markets”. You would need to look at the curve at more tenors to see what was going on.
Any examples of a yield curve that has predicted recessions ala the US over a good stretch? (With data, of course…).
The issue is that getting good data before 1980 or even 1990 is tough; the further back you go, the more you run into things like interest rate regulation (gasp – financial repression!). Even the US yield curve data is not very meaningful before the end of the 1960s as a result of regulations, And “The Great Moderation” meant that there were few cycles in the post-1990 period, which is about the only run of good data. (And as an added bonus, developed countries other than Japan had correlated business cycles from 1990-2008.)
– The euro area countries converged, so the yield curves reflected what was happening across the region.
– The Canadian curve was relatively sensible, but there is a lot of correlation with the US.
– Australia may be OK, but the curve was normally inverted. So you would need to adjust what you are looking for – it will be more inverted than usual. But Australia also avoided recession for almost all of the period 1990-GFC.
– For the UK, the 5-year point may give a better read. The curve beyond the 5-year inverted as a result of pension changes in the 1990s. The BoE has some good yield curve data going back to 1979 or so. I guess that yields were regulated before that (or my data sources were horrible).
– For Japan, there’s a relatively long history for the 5-year. But the economy was similar to Chona’s now, and I am unsure how useful the bond market was.
– I think the Swedish curve was relatively clean, but I never looked at it in detail.
This stuff used to be my day job. What you find is that it was hard to get good international yield curve data until the swap market got going.
From what you’re saying, Brian, there appears to be little evidence of this indicator… no?
The US has very weak auto-stabilisers – since they are obsessed with the powers of the Wizard of Oz in the Federal Reserve.
An interesting graph would be to see the level of net-saving within the economy – to see what happens to the loan/saving ratio and whether that is being offset by Federal/government injects (automatic or otherwise).
Ultimately you get a recession when spending stops happening. So it’d be interesting to see where the spending shifts to.
You could also say that an inverted U.S. yield curve predicts U.K. recessions , probably better than the U.K. curve does. Given the importance of the U.S. consumer to the world economy , it’s probably reasonably predictive for a lot of countries with significant exports to the U.S. Which would be pretty ironic if it’s all because of our own self-fulfilling beliefs.
I don’t see it…
Inverted yield curves may be symptoms of other problems in the economy, that the Fed attempts to resolve using monetary policy.
The Federal Reserve increased short term interest rates during the dot com and housing bubbles to counteract obvious bubbles.
The recessions of the early 80s were caused by the Fed jacking short term interest rates to the moon in an attempt to control inflation.
As for other countries, their economies are smaller and less insulated from international factors which may overwhelm monetary policy.
In my opinion, the global economy is now integrated to the extent that inverted yield curves in the U.S. are less likely to occur and signify anything. That will certainly be the case until the economy turns around, and possibly beyond as monetary policy falls out of fashion…
hi Phil,
I read this comment by Mark Sadowski over at Sumner’s site, and wondered whether it was a correct description of your views regarding inflation:
“I’ve noticed that a key belief that British anti-monetarists (e.g. Philip Pilkington) all seem to share is that high inflation is really a cost-push phenomenon that is driven by wages. The empirical evidence, at least with respect to the US, is that this is definitely not true.”
http://www.themoneyillusion.com/?p=26562#comment-329004
Basically accurate. Except that I’m Irish, not British. As to the point about data, I’ve debated Sadowski before. He has some funny ideas about using data. The data definitely supports the cost push argument. See:
I’ve dropped by to nitpick.
1) Although typically the central bank policy rate is close to the short term rate on the central government securities, it’s customary to measure the slope of the yield curve using a short-term security yield and not the central bank policy rate.
2) At least on a monthly average basis, the UK yield curve did *not* invert in 1976 or 1981, and it *did* invert in 1973. Given the fact that short term rates are near zero and the 10-year gilt has never yielded much less than 1.6% it could not have been easily inverted before the UK’s most recent recession.
3) The Japanese rate labeled the “overnight” rate is really the rate for Treasury Bills, which is actually appropriate since it’s a central government security. (Note however that the Japanese overnight rate, or “call” rate as its known, was above the 10-year Treasury bond yield from July 1989 through March 1992 with the exception of February and March 1990.) Moreover the Treasury Bill yield has been at or below 0.75% since June 1995 and the 10-year Treasury bond yield has never been much less than 0.5%, so again it would have been rather difficult to invert the yield curve in the past 20 years.
Here’s a paper that looks at eight advanced nations (including the US, the UK and Japan) during the 1970s, 1980s and early 1990s and concludes that the yield curve was useful for predicting recessions in nearly all of them:
Click to access work37.pdf
Here’s a paper that looks at the emerging nations and interestingly finds that for nations pegged to the US dollar the US yield curve has more predictive power than the local yield curve:
Click to access ecbwp691.pdf
1) Does it make a substantial difference? If not, please don’t bring it up. It comes off badly. Update: I just checked. It makes almost no difference, as I suspected.
2) Evidence, pleez?
3) Still, lot’s of recessions. No inversions.
4) …
5) Regarding US dollar peg correlation: well duh!
1) It’s relevant because you claimed to be quoting the overnight rate for Japan when it was really the Treasury Bill rate. If you actually look at the BOJ call (overnight) rate you’ll see it does invert in 1989-92. But the Treasury Bill rate is the correct rate anyway.
2) Here’s the monthly average 3-month and 10-year rates for the UK :
https://research.stlouisfed.org/fred2/graph/?graph_id=172541&category_id=
The spread is negative in July and November 1973. It is not negative in either 1976 or 1981. And it makes absolutely no difference if you look at the bank rate instead:
http://www.bankofengland.co.uk/monetarypolicy/Pages/decisions.aspx
3) It *can’t* be inverted at the zero lower bound.
P.S. You’re welcome.
2) It didn’t invert in 1976. It quite clearly did in 1981. See here.
3) Of course it can. If the BoJ raised interest rates substantially it would invert. The point still stands though (backed by the BIS paper you provided): in Japan there is not much relation between the yield curve and recessions.
2) The graph shows an inverted UK yield curve from June 1979 through October 1980, but not in 1981. There was a recession from 1980Q1 through 1981Q1. The yield curve would not invert again until January 1985.
3) I’m assuming the central bank isn’t run by complete idiots. Once the short end of the yield curve is pinned to zero the yield curve looses its predictive value for what I thought were obvious reasons. See this for example:
http://krugman.blogs.nytimes.com/2011/05/30/the-unkillable-yield-curve-fallacy-wonkish/
1) Yeah, allow a 12 month lag. That’s what I said in the post and that’s what the BIS paper says too. Seems appropriate.
2) Please don’t link to Krugman as an authoritative source… If you want someone who regularly fumbles the empirics he’s your man. Of course, I’m aware that raising rates in Japan would be stupid. But that doesn’t eliminate the fact that it is a possibility. The key point here is that the economy can enter recession for reasons other than the yield curve inverting. That’s all. Simple point.
1) But as you said in your post:
“This graph is pretty rough but the green lines are the starts of recessions and the thinner black lines are points when the short-term interest rate rose above the long-term interest rate without causing a recession.”
Apart from the line in 1976 and the line in 1981 all of the black lines are placed exactly when the short term rate rises above the long term rate, not one year after the fact.
2) The long-term rate is essentially a prediction of future short-term rates. At the zero lower bound the long-term rate has to be above the short-term rate because short rates might move up but they can’t go down.
1) I’m trusting that the reader can look to see if there was or was not a recession within 12 months of the black line.
This is getting boring now, Mark. You’ve made your points. Some were interesting. Some were not. Time to move on.
Also, I just read the regression results in the BIS paper. They agree with my piece: it holds in some countries but is by no means a constant across space and time. The UK remains an outlier, as I said it was, so does Japan.
Belgium, the Netherlands and Germany were likely in currency pegs for most of the observed years. So, the former two were likely following the latter. The results for Canada and France are by no means definitive either.
I would say the findings her strongly support what I said in the above piece. I might add the regression table in an update.
Are the conclusions that if a curve derived from some arbitrary and likely not very accurate aggregate data fits the preconceived belief of the author then it is ‘evidence’, otherwise cognitive dissonance filters it out completely?
🙂
I used to think data mining and curve fitting was bad in the investment sector until I started talking to economists.